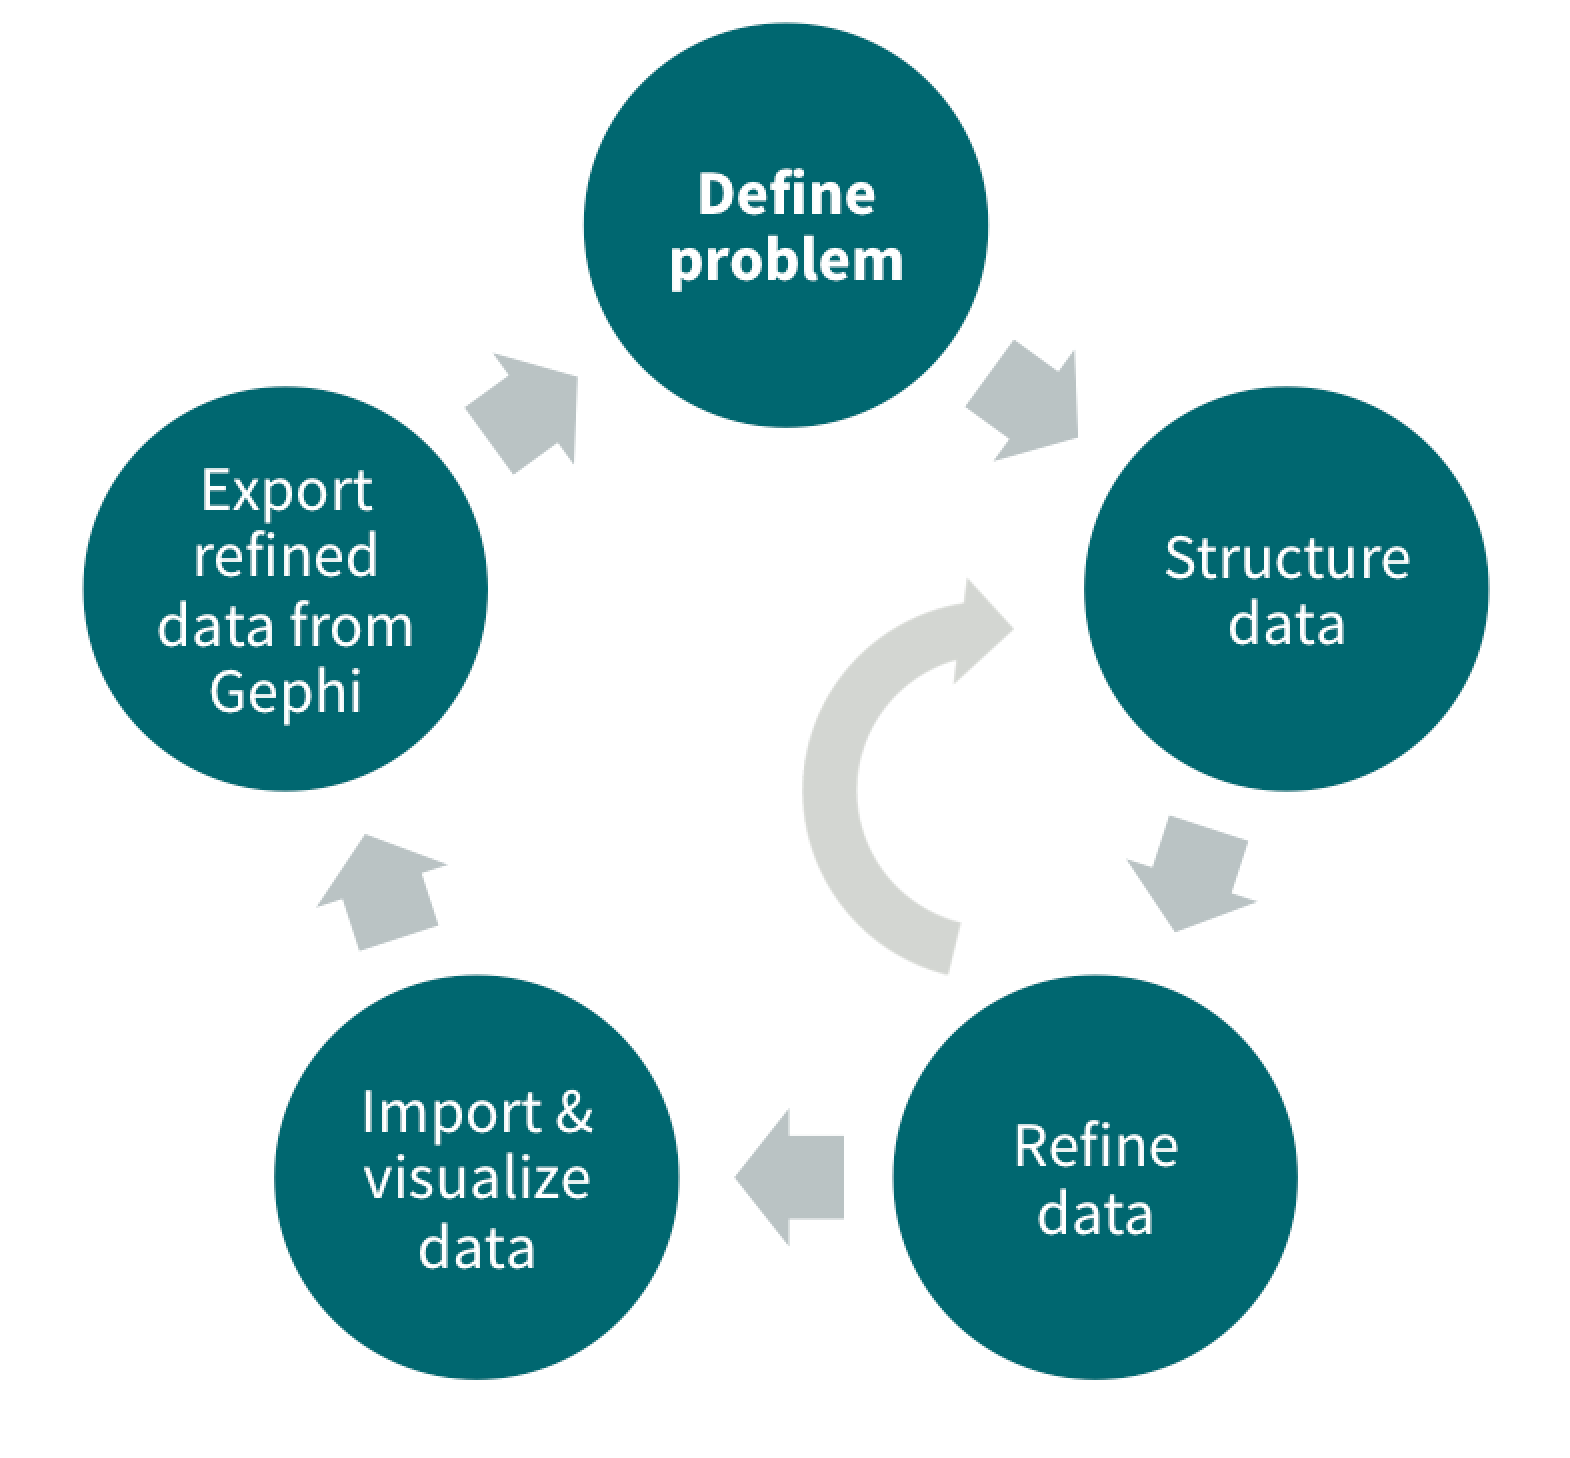
This post contains resources from a data-normalization and structure workshop oriented toward network analysis, and particularly with Gephi. The primary focus was on shifting from the collection of humanities evidence to aggregate data using the following process:”
Defining the problem
What constitutes a relationship?
- People? Letters? Roads? Words? Grammatical constructs?
- Networks aren’t just about people. This jet fighter visualization is a particularly fun way of thinking about the materiality of networks.
Are there multiple kinds of network relationships?
- Unidirectional
- Bidirectional
Are there multiple kinds of actors in relationships?
- Unimodal? Bimodal? Multimodal
How do you want to understand these relationships?
- All modes? All directions?
- Intermediary modes?
- Combined with another digital approach? (Text mining, coding schema, topic modelling, GIS, etc.)
Structuring data
Using existing datasets—biographic databases, etc.—or sample datasets can jumpstart the data-structuring process.
- Sample datasets from Gephi’s wiki
- Sample datasets from Stanford’s DH institute
- Bibliographic databases from the US Library of Congress
Refining data
Keeping the data-structure and data-refinement/clean-up steps separate can help differentiate between what the dataset should contain and the tedious work of cleaning and importing data. There are lots of data cleanup tools suited to varying levels of data complexity. A few to look at closely:
- Excel. It’s easy to overlook Excel, but learning a few tricks with pivot tables and formulas can ease the data cleanup process. -OpenRefine (or Google Refine) provides a simple, powerful interface for cleaning and filtering data.
- Regular expressions can be used to split data on specific patterns and/or remove extraneous data, making data cleanup much faster. Use RegExOne as a first-encounter tutorial and RegExr to test patterns on your data without making any undoable changes.
- HTML special-character references litter the internet and are great as guides for stripping out curvy quotes, em dashes and other by-products of Word.
- The Programming Historian has several great tutorials, including one on normalizing data using Python
- 29 Sept 2014 ADDENDUM via several Tweets: http://textmechanic.com
Visualizing and confirming refinement with Gephi
There are hordes of Gephi tutorials in the wild, so the key thing to remember here is that a Gephi visualization—any data visualization, in fact—is part of the data-cleanup process.
- Data-cleanup mistakes are easier to see when they’re visualized, so checking outliers and patterns for accurate data is a vital part of any visualization process
- Gephi’s statistics processing is very handy. You can calculate betweenness, centrality, etc. and then reimport that into your dataset for use later.
- If you’re working with a multi-modal network and you need to collapse it into a unimodal network to see relationships between like nodes, there’s an app for that: Multimode Networks Transformations